
Prop AMMs on Solana: BisonFi Ends HumidiFi’s Dominance With $11.5B Volume
Onchain data shows how BisonFi’s rapid ascent has reshaped Prop AMM market share, execution dynamics, and capital efficiency across Solana.
- Published:
- Edited:
Competition among Solana’s Prop AMMs has intensified once again. Over the past month, market dynamics within this niche have shifted meaningfully, driven by a sharp increase in activity on BisonFi. This recent growth has altered the long-standing balance of power, bringing an end to HumidiFi’s extended period of dominance and reshaping how routed volume is distributed across the Prop AMM landscape.
Volume Expansion and Market Reallocation
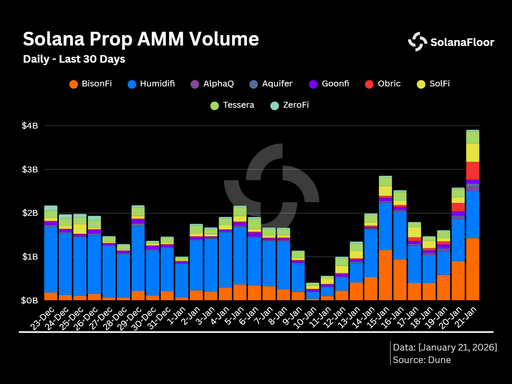
 According to Dune Analytics data, BisonFi’s daily trading volume increased from approximately $180M in late December to over $1.43B by January 21. Over the same 30-day period, daily trading volume across all Prop AMMs reached $4B, setting a new all-time high for the sector.
Other venues have also posted notable gains. Obric recorded a new daily volume high above $400M during the same period, representing more than a fivefold increase compared to its 7-day average.
 This expansion has materially changed market share distribution. BisonFi now accounts for over 35% of daily Prop AMM volume, while HumidiFi’s share has declined to around 26.5%. This marks a significant reversal from just one month earlier, when HumidiFi controlled more than 68% of daily volume and BisonFi represented less than 9%. Orbic, meanwhile, has grown its share to more than 13% of total Prop AMM volume. Tessera has remained comparatively stable, consistently capturing between 7% and 12% of daily volume, suggesting a more mature and steady usage profile.
Pair Concentration and Market Structure
 Trading activity across Prop AMMs remains heavily concentrated in $SOL-$USD pairs. On BisonFi, 100% of recorded volume over the past 30 days has been routed through this pair. HumidiFi shows a similar pattern, with more than 89.2% of its volume tied to $SOL-$USD. However, this represents a modest diversification compared to the previous month, when $SOL-$USD accounted for over 99% of its activity.
Other platforms exhibit greater pair diversity. ZeroFi stands out as the most diversified venue, with $SOL-$USD comprising as little as 12.2% of its total volume over the past 30 days. SolFi follows a comparable trajectory, with SOL-USD’s share declining to a low of 21.4%.
Weekly Activity and Aggregator Routing
 Looking at shorter time frames further illustrates the scale of Prop AMM adoption. Over the past seven days alone, more than $11.5B in trading volume through $SOL-$USD pairs has been executed on BisonFi and HumidiFi combined, cementing their position as the two largest Prop AMMs on Solana. Tessera and SolFi follow at a distance, with $1.35B and $1.03B in weekly volume, respectively.
 Prop AMMs have emerged as the primary execution venues for trades routed through Jupiter. Over the past 30 days, more than 92% of all Jupiter-routed trades were executed via Prop AMMs. Although this share temporarily declined to 71.3% on January 11, subsequent growth, driven largely by BisonFi, has restored and reinforced Prop AMM dominance.
Liquidity in Context
The contrast between Prop AMM liquidity and traditional DEX liquidity is striking. Raydium currently holds around $646.7M in liquidity, while Meteora sits near $207.7M. By comparison, liquidity in HumidiFi pools stands at approximately $13M, and BisonFi at roughly $5M. Despite this disparity, Prop AMMs continue to capture the overwhelming majority of routed volume, underscoring their capital efficiency.
Quantifying the Shift in Solana’s Prop AMM Market
Over the past 30 days, Prop AMMs on Solana recorded a new all-time high of $4B in daily trading volume. On the same day, BisonFi generated $1.43B in volume, capturing more than 35% of daily market share. Over the last seven days, BisonFi and HumidiFi collectively processed more than $11.5B in $SOL-$USD trading volume, while Prop AMMs accounted for over 92% of all trades routed through Jupiter.
The data also underscores the intensity of competition in this segment, where market leadership rarely lasts more than a few months as share rapidly rotates between competitors. Capital efficiency and execution quality are now the primary forces shaping Solana’s market structure.
This piece is part of our Solana Data Insights series. Make sure to subscribe to Solana Data Insights for weekly onchain analysis.
Read More on SolanaFloor
Prediction Markets on Solana: $28.6M in Early Onchain Volume Across Jupiter and DFlow
World Liberty Financial Explodes as Trump Family Crypto Venture Goes Mainstream!